The Google Analytics and its features blog explained by Digital Marketing Agency in Mumbai helps you understand the basics of Digital Marketing. Google Analytics was introduced in the year 2005 and has some pretty basic features to boast about. With time, this versatile tool has improved a lot and added a lot of incredible features. It has metamorphosed into a full-fledged business measurement platform and can be utilized with websites, mobile applications, and a large number of web-connected devices. Many features remain unexplored and are worth a look.
Further, let us understand Google Analytics and its features explained by a Digital Marketing Agency in Mumbai through this blog.
Dashboard:
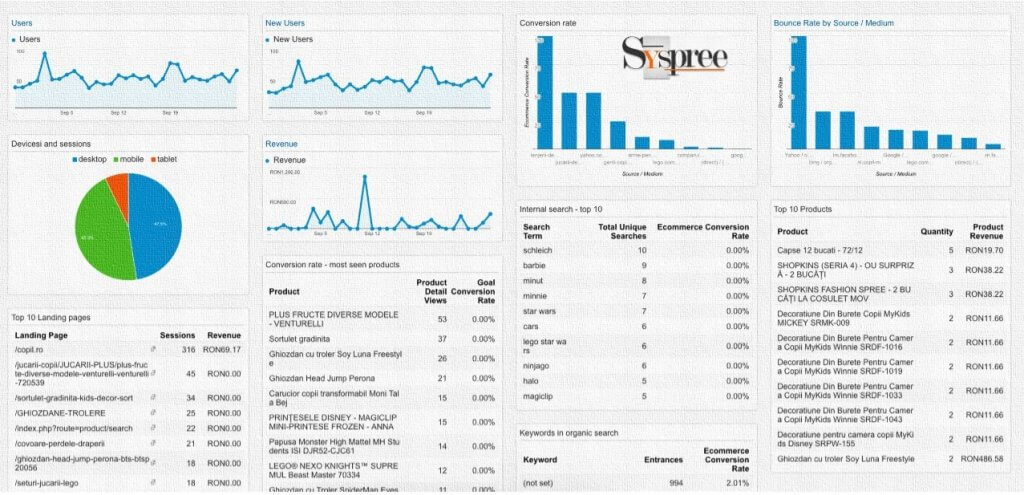
Dashboards are designed to provide an instantaneous view of many primary reports so that individual reports don’t have to be located. It is the tool that allows bookmarking of reports that matter. Adding a report to the dashboard is easy and can be done by navigating to the report and clicking on the “Add to Dashboard” button provided below the report title. These reports can differ from person to person: Keywords, visits, conversions, visits by traffic type, etc.
Annotations:
This is a primary notes tool. Let us assume there was an event you had and you have sent out an email campaign or even featured in a magazine. All these events can be marked against the overview timeline so that during the monthly review, the spikes or drops can be attributed to all that happened on a particular day.
Automatic Email Reports:
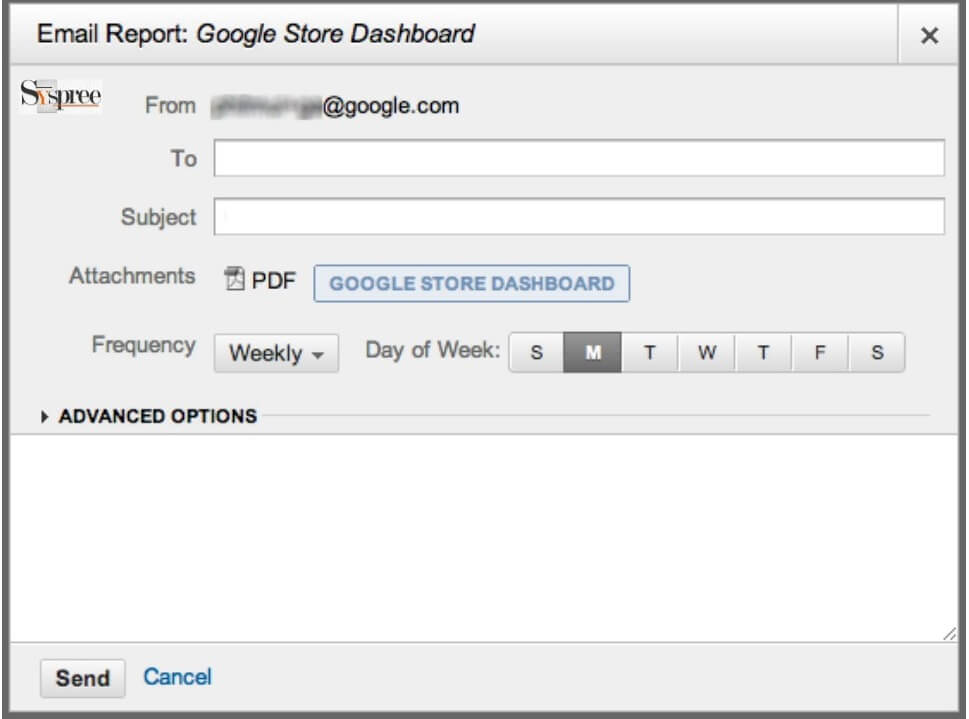
This feature is a great way to stay connected to your reports and you can also skip logging on to Google Analytics if you are happy with the email report (unless you need more details). The email frequency, expiration date, etc. can be set once your Dashboard has been set up.
Alerts:
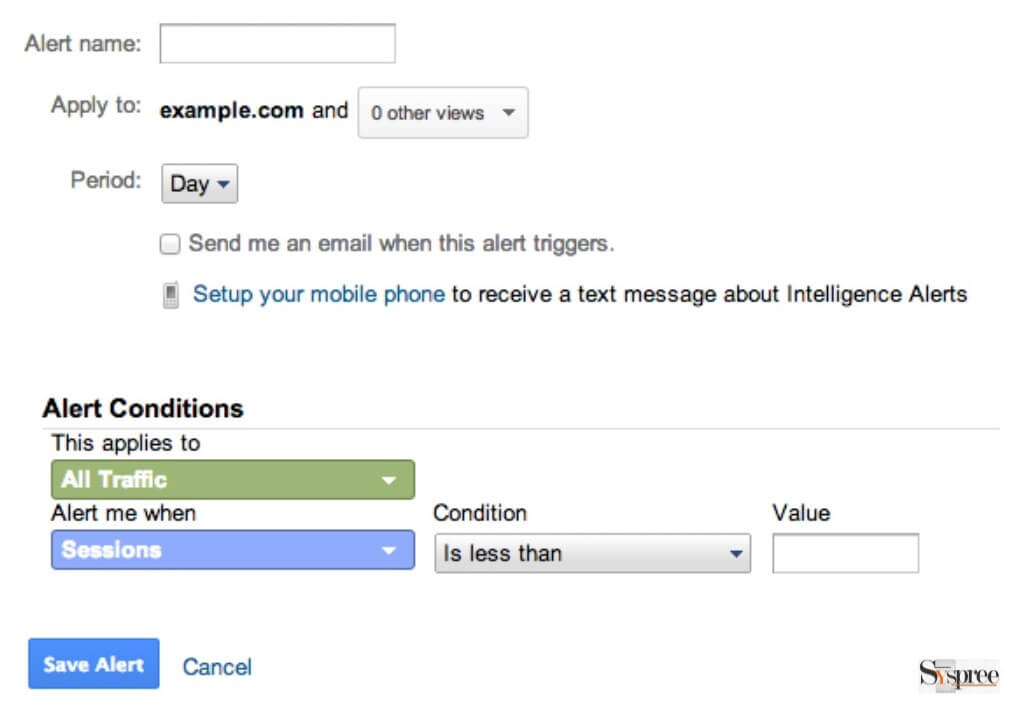
This feature is similar to Email report automation as it sends data and information into your inbox, provided certain criteria have been met. If your visits drop below a certain level or have increased by a specific percentage or if there is a sharp increase in the bounce rate etc. This alert is useful as you do not have to wait for your monthly report and then act and it allows immediate action so there is no further loss.
Segments:
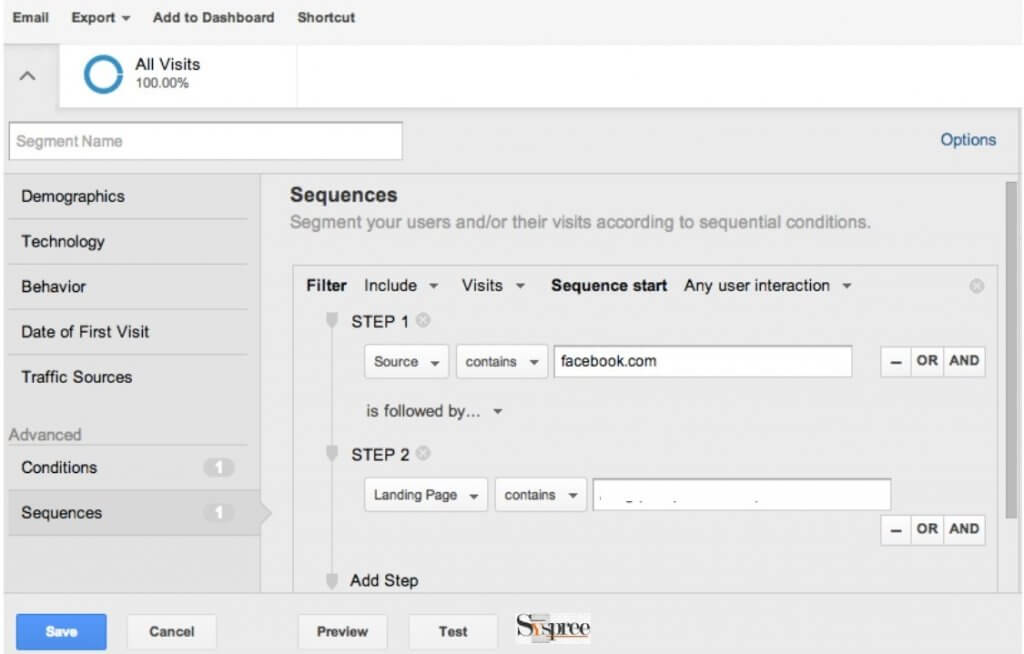
This tool is created so that your site traffic can be divided into segments which allows you to analyze it further or compare it against general traffic. It is possible to set up segments as per users making use of a specific device, traffic received from a particular channel (email, Twitter, Facebook), or by geographical area. After a particular segment is applied, it is possible to view all the reports of Google Analytics, but only about those of a certain segment or division of users. This feature allows comparison between two segments by turning both of them on.
Views:
Mostly there is an account for your company’s Google Analytics and also a property per website within this. However, many users are unaware of the fact that having multiple views on the same website. The master view includes raw data and includes internal website traffic and spam traffic referrals.
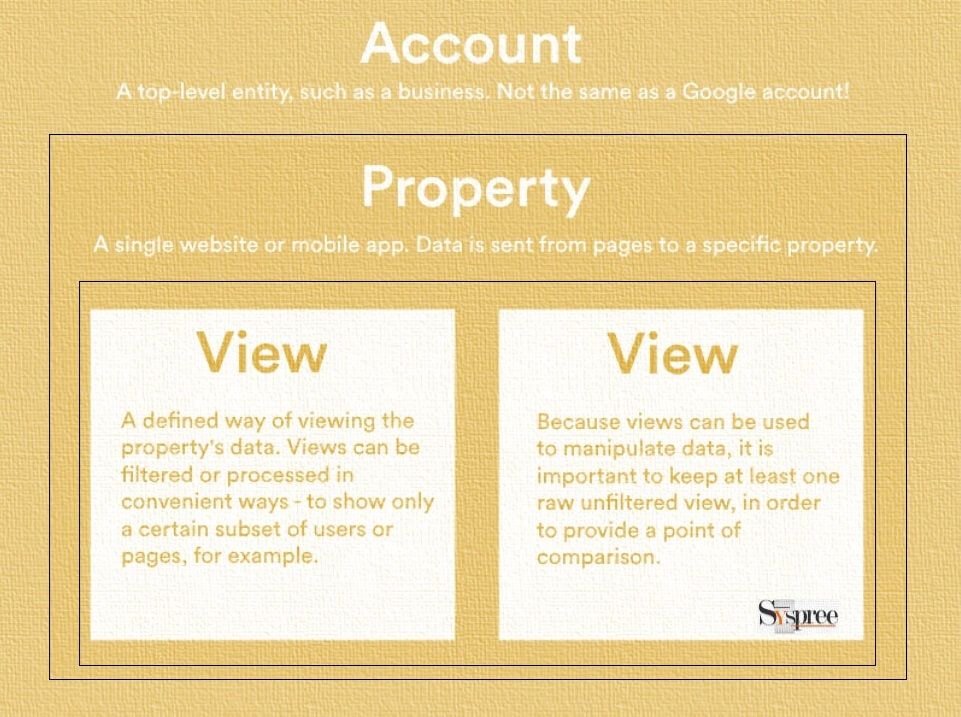
There also may be different views to allow you to see particular data sets like the sales website section, blog section, and a view to test before applying goals and filters. Views using filters are a useful method of narrowing down data. This is a great way of making sure that the data you are watching is relevant as it can be utilized to eliminate traffic which comes from internal staff networks and are often spam.
UTM code or Custom Campaign Tagging: This is a valuable tool that allows segregation of traffic that comes in from any place that uses a hyperlink like social media, banners, e-mail campaigns. After this link is tagged along with the UTM code, you can see how many users visited your site through a specific channel and their behavior after they got to the site. The link with the UTM code can be generated with a Google tool called URL builder. The link has to be put out to the world to watch the results flow in.
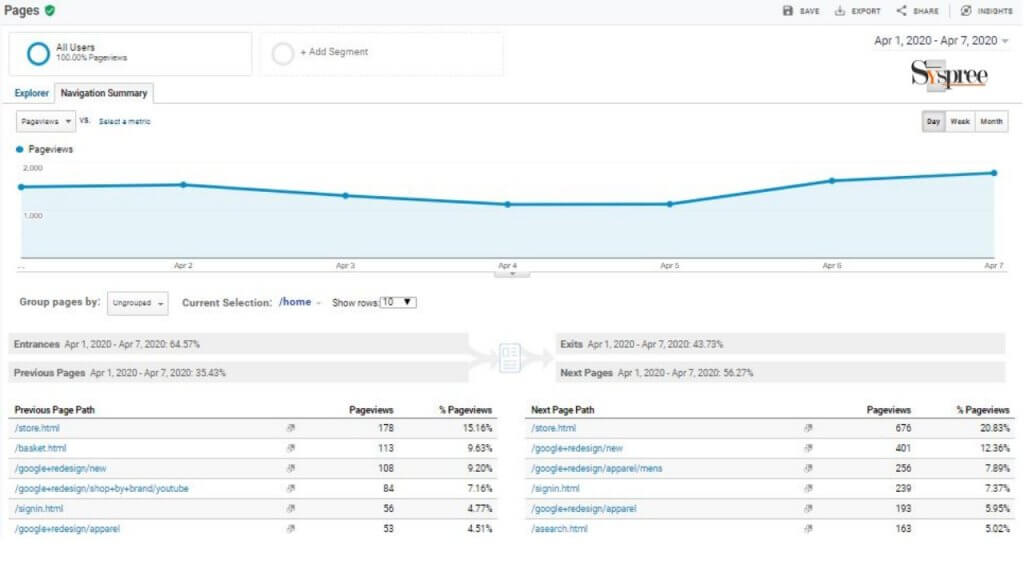
Navigation Summary: This report shows the maneuverability of your users. You can find out where do the users go first after reaching the homepage or how do they reach the contact page. If your desired navigation path is x and users are following the path, maybe it’s time for some re-arrangement on the page for achieving the desired results.
Total Google Ads Integration:
Google Analytics can provide you with data about every campaign, keyword, or group if you have advertised through Google Ads. You can access the number of clicks, displays, conversion, and if it ends in a financial transaction, or any other goal that has been predefined. This tool will then provide you with the margin by working out the cost of acquiring the client v/s the revenue.
With many top-notch Digital Marketing Agency in Mumbai, it is possible to get much such detailed analysis that will give some amazing guidelines for attracting consumers & increasing sales.
If you enjoyed reading the above blog and want to know more about the services of the leading Digital Marketing Agency in Mumbai, feel free to check out our latest blogs on What is Digital Marketing? or The 4Ps of Digital Marketing.


